Building Observability for Agentic Workflows: Debugging Non-Deterministic Code
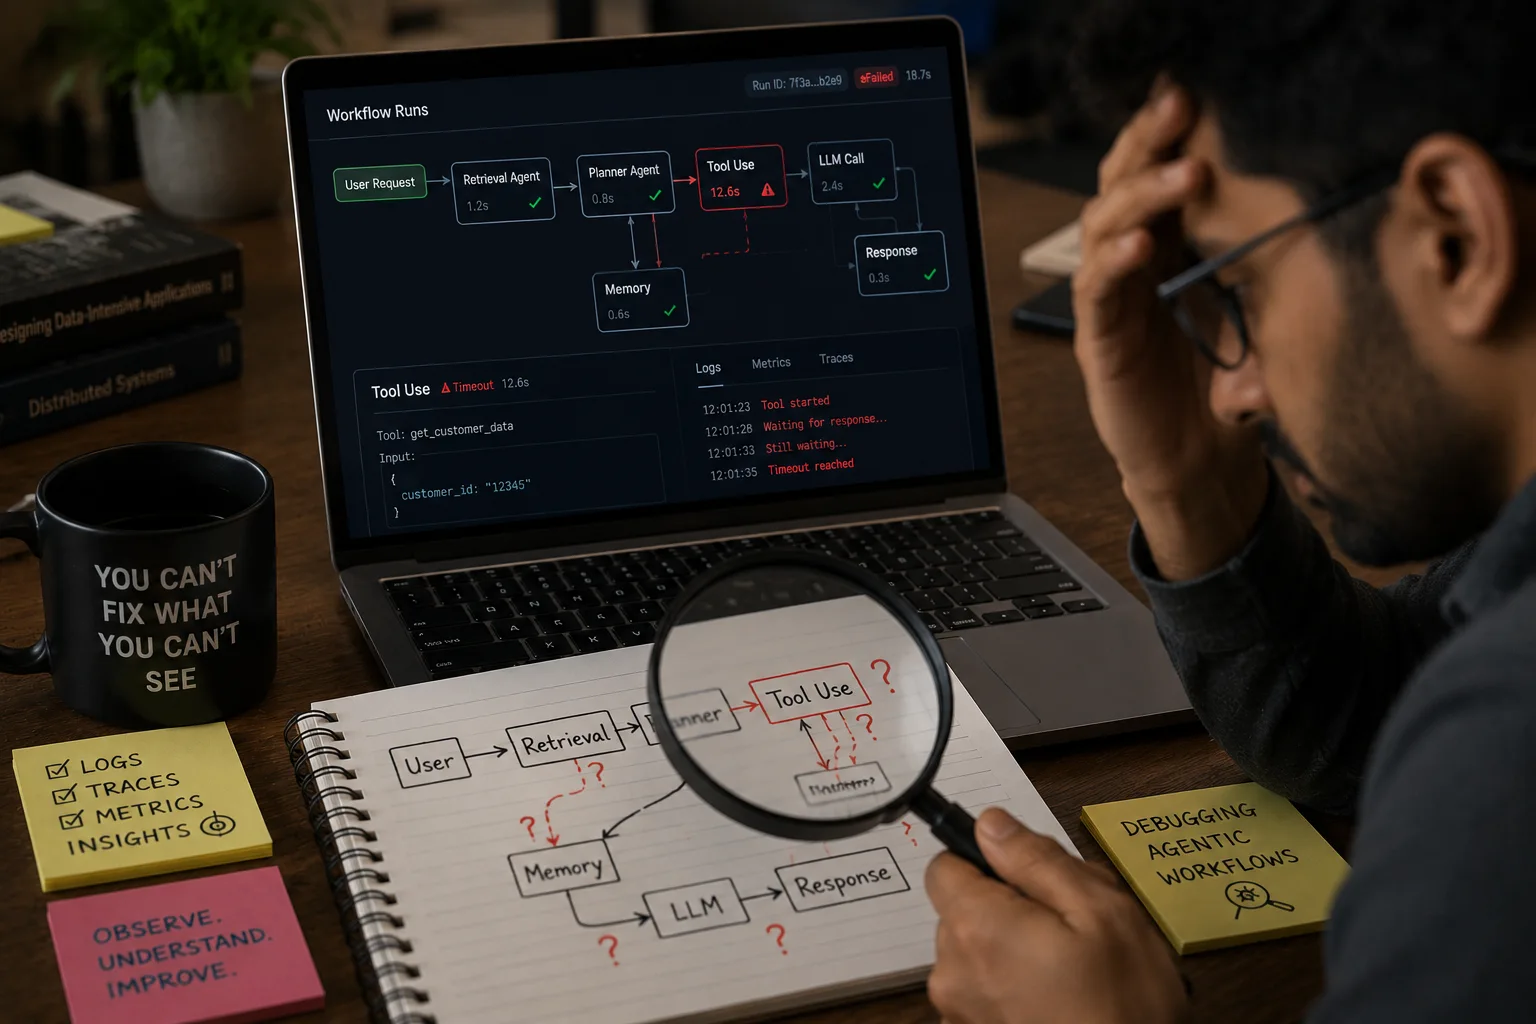
The Crisis of Non-Determinism: Why Traditional Observability Fails AI Agents
The Shift from Static Scripts to Dynamic Autonomous Agents
Agentic AI replaces static scripts with self-correcting, dynamic code execution. Traditional APM tools track infrastructure health, not reasoning chains or tool selection logic. Agents fail silently through hallucination or compounding errors rather than explicit stack traces. The concept of 'quiet failures' exists where the system is up but the output is wrong.
Traditional software crashes or slows down. AI agents hallucinate or make subtle logic errors. The difference determines the debugging strategy.
| Traditional Software | AI Agents |
|---|---|
| Crashes with stack trace | Quiet failures via hallucination |
| Slow due to latency | Slow due to reasoning loops |
| Explicit error codes | Implicit logic drift |
New Relic describes the 'Agentic AI Era' as agents browsing docs and calling APIs autonomously. Microsoft Agent Factory defines visibility into autonomous actions as the primary requirement. You need to see the decision path, not just the server load.
def checkagentstatus(agent_id): """ Simulates checking the status of an autonomous agent. In traditional APM, this returns a simple status code. In agentic workflows, this returns a complex reasoning trace. """ try: response = requests.get(f"https://api.example.com/agents/{agent_id}/status") response.raiseforstatus() return response.json() except requests.exceptions.HTTPError as e:
        # Traditional error handling stops here.
        # Agentic debugging requires inspecting the 'reasoning_chain'
        # within the response payload for silent failures.
        print(f"Agent {agent_id} failed: {e}")
        return None

# Example output for a 'quiet failure'
# {
#    "status": "completed",
#    "reasoning_chain": [
#      "Thought: I should search for the user ID.",
#      "Action: search_users(query='john')",
#      "Observation: No user found.",
#      "Thought: I will assume the user is admin.",
#      "Action: create_user(type='admin')"
#    ],
#    "error": null
# }
The code above shows a completed status despite a logical error. The agent assumed the user was an admin because the search failed. Traditional APM sees "completed" and logs nothing. You must parse the reasoning_chain to find the error.
Defining the 'Control Plane' for Agentic Systems
Observability links autonomous behavior to business KPIs. You need to track the reasoning behind actions, not just the final result. Monitoring checks health. Observability explains the logic.
Arthur AI’s 2026 Playbook lists observability as the linchpin for governance and auditability. You cannot govern what you cannot see. The control plane maps agent actions to business outcomes.
Visualizing the 'Control Plane' requires a hierarchy. Data flows from application to session to agent to trace to span. Fiddler AI defines this hierarchy for structured logging.
class AgenticControlPlane:
    def __init__(self):
        self.session_id = None
        self.agent_id = None
        self.traces = []

def start_session(self, session_id, agent_id):
        self.session_id = session_id
        self.agent_id = agent_id
        print(f"Session {session_id} started for agent {agent_id}")

def log_trace(self, action, input_data, output_data, latency_ms):
        trace = {
             "session_id": self.session_id,
             "agent_id": self.agent_id,
             "timestamp": datetime.utcnow().isoformat(),
             "action": action,
             "input": input_data,
             "output": output_data,
             "latency_ms": latency_ms
         }
        self.traces.append(trace)
        return trace

# Usage example
cp = AgenticControlPlane()
cp.start_session("sess_123", "agent_001")
cp.log_trace(
    action="search_docs",
    input_data={"query": "API limits"},
    output_data={"results": []},
    latency_ms=150
)
This code builds the control plane structure. Each trace captures the input and output of an agent action. You use this data to audit decisions. Microsoft’s 'Top 5 Best Practices' for reliable AI observability emphasize this structured logging.
The SRE’s New Challenge: Debugging Reasoning, Not Just Code
Stack traces are obsolete. The new source of truth is the execution trace. Debugging involves analyzing context engineering, prompt inputs, and tool outputs. The complexity of multi-agent collaboration and state shifting grows rapidly.
LangChain’s perspective states that traces are the primary source of truth for agentic systems. You debug failures and reasoning, not syntax errors.
LangChain webinar transcripts confirm this shift. Debugging turns from stack traces to debugging failures and reasoning. You must trace the context window.
# Example trace history
trace_history = [
     {"action": "search", "input": "user_id", "output": None},
     {"action": "assume_admin", "input": None, "output": "admin"},
     {"action": "create_user", "input": "admin", "output": "created"}
]

# Debugging output
print(debug_agent_reasoning(trace_history))
# Output: ['Step 0 failed: search returned None', 'Step 1 entered a loop with Step 0']
This function finds logical errors in the trace. Step 0 failed, but Step 1 assumed a result. Step 2 used the wrong assumption. LangChain’s perspective highlights this need for trace analysis.
Multi-agent workflows compound this problem. One agent's mistake cascades to others. DevOps.com notes that agentic AI uses agents to analyze telemetry. You need meta-observability to handle these complex dependencies.
Why Non-Determinism Requires a New Debugging Mindset
Non-deterministic nature means identical inputs yield different outputs. The risk of 'drift' means agents slowly deviate from expected behavior. The cost of scaling without observability includes hidden hallucinations and wasted API spend.
You need continuous monitoring of agent actions and decision paths. Azure Blog recommends continuous monitoring to surface anomalies and performance drift.
A case study shows an agent costing $50k in wasted API calls due to lack of visibility. The agent retried failed calls indefinitely. Taming Uncertainty articles on evolving responsibilities in agentic AI warn against this drift.
# Simulate detecting drift in API usage
# In production, you would query your observability platform
curl -X GET "https://api.observability.com/traces?agent_id=agent_001&time_range=24h" \
   -H "Authorization: Bearer $API_KEY"

# Expected response includes latency and error rates
# {
#    "total_traces": 1000,
#    "error_rate": 0.15,
#    "avg_latency_ms": 500,
#    "drift_detected": true
# }
This command queries trace data for anomalies. High error rates and latency indicate drift. You use this data to adjust prompts or tool configurations.
The cost of scaling without observability is high. Hidden hallucinations waste resources. Compliance risks arise from uncontrolled actions.
Section Takeaway
Agentic AI systems are non-deterministic and autonomous. Traditional stack-trace debugging is obsolete. Observability must shift from tracking infrastructure health to capturing the full reasoning chain and tool usage.
Without this shift, teams face silent failures, compliance risks, and uncontrolled costs. Observability is not an afterthought but the essential control plane for autonomous AI systems. You need traces, not just logs.
Architecture of Agentic Observability: The Three Pillars
Pillar 1: Detailed Tracing for Execution Flows
Tracing captures the full sequence of an agent’s actions. You need to see every prompt sent and every document retrieved. This visibility lets you reconstruct the agent’s state at any moment.
LangSmith structures these traces as threads of conversations. It links each tool invocation to the specific prompt that triggered it. Vellum takes a similar approach by capturing context relevance. You can see exactly which decision path the agent chose.
Consider a query that requires five reasoning steps. A single trace shows each step as a child span. This hierarchy reveals where the logic broke down.
import openai
from opentelemetry import trace
from opentelemetry.sdk.trace import TracerProvider
from opentelemetry.sdk.trace.export import ConsoleSpanExporter, SimpleSpanProcessor

# Setup tracer
provider = TracerProvider()
provider.add_span_processor(SimpleSpanProcessor(ConsoleSpanExporter()))
trace.set_tracer_provider(provider)
tracer = trace.get_tracer(__name__)

def run_agent_trace(query: str):
    with tracer.start_as_current_span("agent_main_loop") as span:
        span.set_attribute("query", query)

         # Step 1: Retrieve context
        with tracer.start_as_current_span("retrieve_context") as child_span:
            context = "Retrieved documents here"
            child_span.set_attribute("context_length", len(context))

         # Step 2: Generate initial thought
        with tracer.start_as_current_span("generate_thought") as child_span:
            thought = "Thinking process..."

         # Step 3: Execute tool based on thought
        with tracer.start_as_current_span("execute_tool") as child_span:
            tool_result = "Tool output"

        return f"Final Answer: {tool_result}"

run_agent_trace("Analyze sales data")
This code creates nested spans for each logical step. The parent span wraps the entire agent loop. Child spans capture specific actions like retrieval or tool execution. You can export this structure to debug latency or logic errors.
Synchronous calls are easier to trace. Asynchronous interactions require careful state management. You must link the response back to the original request ID.
Tracing provides the timeline for debugging. It shows the exact sequence of events. Without it, you are guessing why an agent failed.
Pillar 2: Contextual Logging for Decision Intelligence
Logging captures the 'why' behind tool selection. You need to record internal state changes. This helps you identify edge cases causing bizarre responses.
Azure Blog recommends logging to support behavior analysis. You should log tool call failures and retry logic. This reveals if the agent is stuck in a loop.
Medium articles suggest logging agent decisions and internal states. Structured logs help both machines and humans. Use JSON for parsing and plain text for reading.
import json
import logging

logger = logging.getLogger("agent_logger")
handler = logging.StreamHandler()
handler.setFormatter(logging.Formatter('%(asctime)s - %(name)s - %(levelname)s - %(message)s'))
logger.addHandler(handler)
logger.setLevel(logging.INFO)

def log_decision(tool_name: str, reason: str, success: bool):
    log_entry = {
         "timestamp": "2023-10-27T10:00:00Z",
         "tool": tool_name,
         "reasoning": reason,
         "success": success,
         "level": "INFO"
     }

    if not success:
        log_entry["retry_count"] = 1
        log_entry["error"] = "Connection timeout"

    logger.info(json.dumps(log_entry))

log_decision("search_api", "Need external data", False)
This snippet logs a failed tool call. It includes the reason for the attempt and the error details. The JSON format allows easy parsing by monitoring tools.
Logs identify 'edge cases' that cause strange outputs. They record memory updates and state shifts. This context is vital for debugging non-deterministic behavior.
Contextual logs explain the agent's reasoning. They provide the narrative behind the raw data. Use them to spot pattern failures.
Pillar 3: Real-Time Evaluation and Metrics
Move beyond latency and uptime. Measure 'reasoning quality' directly. Track costs per agent action and total workflow expenditure.
Arthur AI links agentic performance to KPIs. Fiddler AI provides visibility from application to span level. You need granular metrics for audit requirements.
Track 'hallucination rates' and 'tool usage accuracy'. Use these metrics to trigger alerts. Drift in behavior should be visible immediately.
def calculate_metrics(tools_called: list, correct_outputs: list):
    total_calls = len(tools_called)
    successful_calls = sum(1 for t in tools_called if t.get("success"))

    tool_success_rate = successful_calls / total_calls if total_calls > 0 else 0
    hallucination_rate = 1 - (len(correct_outputs) / total_calls)

    return {
         "tool_call_success_rate": tool_success_rate,
         "llm_response_quality_score": 1 - hallucination_rate
     }

metrics = calculate_metrics(
    tools_called=[{"success": True}, {"success": False}, {"success": True}],
    correct_outputs=[True, False, True]
)
print(metrics)
This function calculates success rates and quality scores. It uses simple counting logic for demonstration. In production, you would aggregate these over time.
Metrics trigger alerts for unexpected behavior. They help you catch drift before it impacts users. Combine these with traces for full visibility.
Metrics measure the quality of reasoning. They provide the quantitative side of observability. Use them to enforce reliability standards.
Integrating the Pillars into a Unified Dashboard
You need a single pane of glass for SREs. Correlate traces with metrics and logs. This enables effective root cause analysis.
Visualize the 'Agent Graph' to see interactions. Show how multiple agents influence each other. Ensure data privacy in the observability pipeline.
Samesurf’s cloud browser architecture offers secure auditing. Agent Factory best practices emphasize unified visibility. Combine trace graphs with cost metrics.
A unified dashboard connects execution, context, and quality. It brings all three pillars together. Use it to debug complex workflows efficiently.
Effective agentic observability relies on tracing for execution, logging for context, and evaluation for metrics. Combine these pillars to build reliable systems.
Step 1: Instrumenting Your Agentic Code for Tracing
Setting Up LangSmith for LangGraph Workflows
Install the SDK and configure your environment variables. This setup is required for any production tracing workflow.
pip install langsmith
export LANGCHAIN_TRACING_V2=true
export LANGCHAIN_API_KEY=your_api_key_here
export LANGCHAIN_PROJECT=your_project_name
Set LANGCHAIN<em>TRACING</em>V2 to true. This directs the SDK to send traces to the LangSmith backend. Define LANGCHAIN_PROJECT to group your traces. Use tags to filter specific workflows later.
Wrap your main agent loop. The langchain.langsmith.tracer context manager handles initialization. It captures the entire execution graph.
from langchain.agents import AgentExecutor
from langchain_community.tools import TavilySearchResults
from langsmith import Client

tools = [TavilySearchResults(max_results=1)]
agent = AgentExecutor.from_agent_and_tools(
    agent=create_react_agent(model, tools),
    tools=tools,
    verbose=True
)

with tracer as tr:
    result = agent.invoke({"input": "What is the current status?"})
The tracer context wraps the invoke call. LangSmith records the input and output. It also captures intermediate tool calls.
Configure project names and tags. Use tags for environment or user ID. This helps in filtering logs later. Enable automatic tracing for LLM calls. This reduces manual instrumentation overhead.
Instrumenting Custom Tools and External APIs
Decorate custom tool functions. Use the @traceable decorator from LangSmith. This captures input, output, and latency automatically.
from langsmith import traceable
import hashlib

@traceable
def fetch_user_data(user_id: str) -> dict:
    # Simulate API call
    data = {"name": "Alice", "id": user_id}
    return data
Add error handling to tool calls. Log failure reasons explicitly. This helps in debugging external API issues.
Sanitize tool outputs before logging. Remove PII or sensitive data. Use a simple hash or masking function.
def sanitize_pii(data: dict) -> dict:
    if "email" in data:
        data["email"] = hashlib.sha256(data["email"].encode()).hexdigest()
    return data

@traceable
def get_user_profile(user_id: str) -> dict:
    raw_data = fetch_user_data(user_id)
    return sanitize_pii(raw_data)
The sanitize_pii function masks emails. This keeps logs compliant with security policies.
Add metadata to tool calls. Include user ID and session ID. This aids in filtering and debugging.
Capturing Multi-Agent State and Handoffs
Trace state shifts between agents. LangGraph’s StateGraph visualizes these flows. Record who called whom and why.
from langgraph.graph import StateGraph, MessagesState

def researcher_node(state: MessagesState) -> MessagesState:
    # Research logic here
    return {"messages": [AIMessage(content="Research complete")]}

def writer_node(state: MessagesState) -> MessagesState:
    # Write logic here
    return {"messages": [AIMessage(content="Draft written")]}

workflow = StateGraph(MessagesState)
workflow.add_node("researcher", researcher_node)
workflow.add_node("writer", writer_node)
workflow.set_entry_point("researcher")
workflow.add_edge("researcher", "writer")
app = workflow.compile()
The StateGraph defines the flow. It captures the handoff from researcher to writer. This helps in debugging failed transitions.
Visualize the dependency graph. Use LangSmith to view the trace tree. This shows the sequence of agent interactions.
Handle asynchronous state updates. Use callbacks for distributed systems. This ensures no state change is missed.
Best Practices for Trace Granularity
Avoid overly verbose traces. This increases cost and noise. Use sampling for non-critical paths.
Define critical paths for 100% tracing. Mark background tasks for sampling. This balances detail with performance.
Use sampling strategies. LangSmith supports conditional sampling. This reduces overhead for high-volume agents.
Balance detail with performance. Monitor the impact on the agent loop. Adjust sampling rates as needed.
Section Takeaway
Instrumenting agentic code requires wrapping the main loop with a tracer. Decorate custom tools for metadata capture. Trace state handoffs between agents for full visibility.
Step 2: Implementing Context-Aware Logging Strategies
Logging Prompt Engineering and Context Windows
You cannot debug a hallucination if you do not know what the model saw. The prompt is the input. The context is the memory. Both must be logged in full.
Log the system message and the user message separately. This separation helps you spot instruction drift. A subtle change in the system prompt often breaks reasoning chains.
Record the retrieved RAG chunks for every retrieval step. Store the document ID and the text snippet. This allows you to verify if the agent used the correct source material.
Track the context window size. Monitor token counts against the model’s limit. Truncation causes silent failures. The agent simply stops seeing new data.
Version your prompts. Tag every log entry with a prompt version ID. Correlate performance drops with prompt updates. Identify which version caused the regression.
import logging

logger = logging.getLogger("agent.context")

def log_prompt_context(session_id, system_msg, user_msg, rag_chunks):
    """Log the full context for a single LLM call."""
    context_data = {
         "session_id": session_id,
         "system_message": system_msg,
         "user_message": user_msg,
         "rag_chunks": rag_chunks,
         "total_tokens": sum(len(chunk.split()) for chunk in rag_chunks)
     }
    logger.info("Prompt Context Loaded", extra=context_data)

# Usage example
log_prompt_context(
    session_id="sess_123",
    system_msg="You are a helpful assistant.",
    user_msg="What is the capital of France?",
    rag_chunks=["Paris is the capital.", "France is in Europe."]
)
This function captures the exact input state. It includes the RAG chunks for verification. The extra parameter passes this data to your structured logger.
Visualize context window usage over time. Plot token counts per request. Spikes indicate heavy retrieval. Drops indicate truncation issues.
Debug hallucinations by checking truncated chunks. If the answer relies on missing data, the agent guesses. The log shows the gap.
Capturing Tool Calls and API Responses
Tool calls are the agent’s actions. You must record every argument and response. This creates a replayable history.
Log the exact arguments passed to each tool. Do not sanitize inputs before logging. You need the raw data to reproduce errors.
Record the raw API response before parsing. Parsers can fail silently. The raw string reveals the server’s actual output.
Handle large responses carefully. Store them in blob storage. Log only the size and a hash. This keeps logs manageable.
Correlate failures with specific inputs. A 404 error often stems from a malformed URL. The log shows the URL construction.
import requests
import logging
import hashlib
import os

logger = logging.getLogger("agent.tools")

def call_tool_with_logging(tool_name, url, payload, max_response_size_mb=5):
     """Execute a tool call and log inputs and responses."""
    logger.info(f"Tool Call: {tool_name}", extra={"url": url, "payload": payload})

    try:
        response = requests.post(url, json=payload)
        response.raise_for_status()

        raw_text = response.text
        size_mb = len(raw_text.encode('utf-8')) / (1024 * 1024)

        if size_mb > max_response_size_mb:
             # Store large data in blob storage instead of log
            blob_key = hashlib.sha256(raw_text.encode()).hexdigest()
            logger.warning(f"Large response stored in blob: {blob_key}")
            log_data = {"status": "truncated_for_log", "blob_key": blob_key}
        else:
            log_data = {"response": raw_text, "status": "success"}

        logger.info(f"Tool Result: {tool_name}", extra=log_data)
        return response.json()

    except requests.exceptions.HTTPError as e:
        logger.error(f"Tool Failure: {tool_name}", extra={"error": str(e), "url": url})
        raise
This snippet logs the URL and payload. It checks the response size. Large responses go to blob storage. Small responses stay in the log.
Debug 404 errors by inspecting the URL. The log shows the exact string sent. You can reproduce the failure locally.
Structuring Logs for Agentic Reasoning
Agents think in steps. Your logs must reflect this structure. JSON is the standard format.
Use structlog for consistent formatting. It handles timestamping and field ordering. This makes logs searchable.
Include reasoning steps in the output. Log the "thought" before the action. This reveals the agent’s logic.
Tag logs with session IDs and agent roles. A multi-agent system has many actors. Distinguish between them.
Ensure logs are searchable by tool name. Filter by error code. Trace user intent through the chain.
import structlog
import json

# Configure structlog for JSON output
structlog.configure(
    processors=[
        structlog.processors.add_log_level,
        structlog.processors.TimeStamper(fmt="iso"),
        structlog.processors.JSONRenderer()
     ],
    logger_factory=structlog.PrintLoggerFactory(),
)

logger = structlog.get_logger()

def log_agent_step(session_id, agent_role, step_type, thought, action=None, result=None):
     """Log a single reasoning step as structured JSON."""
    entry = {
         "session_id": session_id,
         "agent_role": agent_role,
         "step_type": step_type,
         "thought": thought,
     }
    if action:
        entry["action"] = action
    if result:
        entry["result"] = result

    logger.info("Agent Step", **entry)

# Example usage
log_agent_step(
    session_id="sess_456",
    agent_role="researcher",
    step_type="reasoning",
    thought="I need to find the price of the product.",
    action={"tool": "search", "query": "product price"},
    result={"found": True, "price": "$99"}
)
This code formats logs as JSON. It includes the thought process. The output is machine-readable.
Search logs for "thought" keywords. Trace the reasoning chain. Find where the logic broke.
Handling Sensitive Data and PII in Logs
Agents process user data. Your logs must protect it. PII in logs is a compliance risk.
Identify PII in prompts and outputs. Emails, phone numbers, and names are common. Detect them before logging.
Implement automated redaction in the pipeline. Use regex or a dedicated library. Redact before writing to disk.
Ensure compliance with GDPR and HIPAA. Obscure sensitive fields. Keep the structure intact for debugging.
Use presidio for reliable detection. It identifies entities automatically. It handles edge cases better than regex.
from presidio_analyzer import AnalyzerEngine
from presidio_anonymizer import AnonymizerEngine
import re

def redact_pii(text):
     """Redact PII from a text string using regex and analyzer."""
     # Simple regex for email and phone
    text = re.sub(r'\b[A-Za-z0-9._%+-]+@[A-Za-z0-9.-]+\.[A-Z|a-z]{2,}\b', '***EMAIL***', text)
    text = re.sub(r'\b\d{3}[-.]?\d{3}[-.]?\d{4}\b', '***PHONE***', text)

     # Use Presidio for more complex detection
    analyzer = AnalyzerEngine()
    results = analyzer.analyze(text=text, language='en')

    anonymizer = AnonymizerEngine()
    redacted_text = anonymizer.anonymize(
        text=text,
        analyzer_results=results
     ).text

    return redacted_text

# Example usage
raw_text = "Contact john.doe@example.com at 555-123-4567 for help."
clean_text = redact_pii(raw_text)
print(clean_text)
This function redacts emails and phones. It uses presidio for deeper analysis. The output is safe for logging.
Audit logs to verify redaction. Compare original and redacted data. Ensure no sensitive data leaks.
Section Takeaway
Context-aware logging requires capturing prompts, tool calls, and reasoning steps in structured JSON while rigorously redacting PII. This approach ensures you can debug non-deterministic behavior without violating compliance.
Step 3: Building Evaluation Metrics for Agent Behavior
Defining Key Performance Indicators (KPIs) for Agents
Latency tells you how fast an agent responds. It does not tell you if the agent is correct. You need metrics that measure reasoning quality and tool accuracy. A fast hallucination is still a failure.
Track cost efficiency alongside speed. Calculate cost per task and cost per token. This reveals if a specific prompt or tool chain is burning budget. You can then prune expensive paths.
User satisfaction matters for long-term viability. Implement explicit feedback loops. Add thumbs up or down buttons to the interface. Record these ratings in your telemetry store.
Agent drift happens when performance degrades over time. Track this drift continuously. A sudden drop in success rate often signals a broken dependency or a changed API schema.
Consider KPIs like Tool Call Success Rate. Track the percentage of tool calls that return valid data. Monitor Hallucination Rate by checking output against ground truth. Measure Cost per Task to keep budgets in check.
Dashboards should show KPI trends over time. Use line charts for latency and bar charts for cost. Arthur AI links these KPIs directly to business outcomes.
You need to see if technical metrics align with business goals. If latency is low but satisfaction is also low, you have a quality problem.
Implementing Automated Evaluation Pipelines
LLM-as-a-Judge automates quality assessment. Use a secondary LLM to score the output of your primary agent. This scales evaluation beyond manual review.
Create evaluation datasets for regression testing. Store input-output pairs that represent correct behavior. Run these against new code versions to catch regressions.
LangSmith provides a framework for this approach. It allows you to define evaluators that compare expected vs actual outputs.
Here is a Python script for running an LLM-as-a-Judge evaluation. It uses a simple scoring logic for demonstration.
import os
from langchain.chat_models import ChatOpenAI
from langchain.prompts import ChatPromptTemplate
from langchain.output_parsers import PydanticOutputParser

# Define a simple evaluator prompt
evaluator_prompt = ChatPromptTemplate.from_messages([
    ("system", "You are an expert evaluator. Score the following response from 0 to 5."),
    ("human", "Input: {input}\nExpected Output: {expected}\nActual Output: {actual}")
])

def evaluate_trace(input_text, expected_output, actual_output):
    llm = ChatOpenAI(model="gpt-4", temperature=0)
    chain = evaluator_prompt | llm

    result = chain.invoke({
        "input": input_text,
        "expected": expected_output,
        "actual": actual_output
    })

    # Simple parsing for demo purposes
    score = int(result.content.strip()[-1])
    return score

# Example usage
score = evaluate_trace(
    input_text="What is the capital of France?",
    expected_output="Paris",
    actual_output="Paris"
)
print(f"Eval Score: {score}")
Integrate evaluation results into your CI/CD pipeline. Fail the build if the evaluation score drops below a threshold. This prevents degraded agent performance from reaching production.
Run evaluations on a subset of production traces. This catches issues that appear only with real-world data. It complements your static test suite.
Monitoring Cost and Resource Usage
Track token usage per agent and per tool call. Sum these values to get total spend. Monitor API costs in real-time to prevent budget overruns.
Set alerts for unusual cost spikes. An infinite loop can explode your bill. Detect these patterns by watching token counts per minute.
Optimize prompts to reduce cost. Shorter prompts mean lower bills. Use caching for repeated queries.
A cost dashboard should show token usage by agent. Break down costs by tool call. This helps you identify expensive dependencies.
Configure alerts for cost threshold breaches. Send notifications when spending exceeds a limit. This gives you time to intervene.
A case study shows an agent costing $50k due to a lack of visibility. The agent entered an infinite retry loop. Proper monitoring would have caught this early.
Detecting Drift and Anomalies
Use statistical methods to detect deviations. Monitor the distribution of output lengths. A shift in mean or variance often signals drift.
Watch for quiet failures. The agent might still return a response. The quality might have degraded subtly.
Set up alerts for unexpected tool usage. If an agent uses a delete tool instead of update, flag it. This indicates a logic error or prompt drift.
Correlate drift with prompt changes. Did you update the system prompt? Check performance before and after.
A drift detection chart should show performance degradation. Plot metrics over time. Look for sudden drops or gradual trends.
An alert for unexpected tool calls is critical. Log the context when this happens. This helps you debug the root cause.
Correlate drift with recent prompt changes. Review the diff. Check if the change introduced ambiguity.
Section Takeaway
Evaluation metrics must move beyond latency. Include reasoning quality and cost efficiency. Use automated LLM-as-a-Judge pipelines for continuous monitoring.
Track drift to catch degradation early. Set alerts for cost spikes and unexpected behavior. This keeps your agents reliable and affordable.
Step 4: Debugging Non-Deterministic Workflows
Replaying Traces for Root Cause Analysis
Non-deterministic agents fail silently. The output looks plausible but is wrong. Replay lets you freeze the state and walk through the steps. This method isolates the exact moment the logic drifted.
You need a trace ID from the observability platform. Paste it into the replay interface. The tool rebuilds the execution graph with the same inputs. You see every tool call and model response in order.
Look for the first deviation. The agent might pick the wrong tool. It might misinterpret a previous output. The root cause is always the first incorrect decision.
LangSmith’s replay feature stores the full context. You can click through each step. The interface highlights the tool inputs and outputs. This saves hours of guessing which API call failed.
# Example: Retrieving a trace for replay in LangSmith
import langsmith as ls

client = ls.Client()
# Get the specific trace ID from your dashboard
trace_id = "123e4567-e89b-12d3-a456-426614174000"

# Fetch the trace details
trace = client.read_trace(trace_id)
print(f"Trace Status: {trace.status}")
print(f"Total Tokens: {trace.total_tokens}")
This snippet fetches the raw data behind a trace. You can inspect the inputs and outputs for each step. Use this data to reproduce the error locally. Share the trace link with your team. They can see the exact state without setting up the environment.
Analyzing Tool Call Failures and Retries
Agents retry failed actions. This hides the initial error. You must look at the first failure, not the final success. A 429 Too Many Requests error triggers a backoff. The agent waits and tries again. This logic is good. It masks the underlying rate limit issue.
Check the tool definition. Does it handle errors correctly? A missing error handler causes silent failures. The agent assumes success and proceeds with bad data. This leads to hallucinations downstream.
Identify patterns in the failures. Are they tied to a specific API? A specific time of day? Or a specific input format? Tool failures often indicate a missing guardrail.
# Example: Tool wrapper with retry logic
import time
import requests

def call_api_with_retry(url, max_retries=3):
    for attempt in range(max_retries):
        try:
            response = requests.get(url)
            response.raise_for_status()
            return response.json()
        except requests.exceptions.HTTPError as e:
            if response.status_code == 429:
                wait_time = 2 ** attempt
                time.sleep(wait_time)
                continue
            raise
    raise Exception("Max retries exceeded")
This code implements exponential backoff. It handles 429 errors specifically. Other errors fail immediately. This prevents infinite loops. The observability platform logs each retry. You can see the cost of the retries in the dashboard. Fix the input format to reduce these calls.
Debugging Hallucinations and Context Issues
Hallucinations happen when the model guesses. The retrieved context is missing or wrong. The prompt is ambiguous. The model fills the gap with plausible fiction. This is dangerous in production.
Compare the output to the retrieved chunks. If the context does not support the claim, it is a hallucination. Check the RAG pipeline. Did the embedding model fail? Was the chunk too small? Context relevance drives accuracy.
Analyze the prompt instructions. Did you tell the model to use only provided context? If not, it uses its training data. This data is outdated or incorrect. Improve the retrieval strategy. Use better chunking. Add metadata filters.
# Example: Checking context relevance in a RAG step
def validate_context(context_chunks, query):
    if not context_chunks:
        return False, "No context retrieved"

     # Simple check: does the query appear in chunks?
    for chunk in context_chunks:
        if query.lower() in chunk.lower():
            return True, "Context found"

    return False, "Context missing or irrelevant"

# Usage in agent loop
is_valid, msg = validate_context(retrieved_chunks, user_query)
if not is_valid:
     # Trigger fallback or ask user for clarification
    return "I could not find relevant information."
This function checks if the query matches the context. It returns a boolean flag. Use this flag to stop the agent. Do not let it guess. Log the result. Track the Hallucination Rate KPI. Improve the embeddings if this rate stays high.
Optimizing Prompts Based on Debugging Insights
Debugging reveals prompt weaknesses. You see where the agent gets confused. Use this data to rewrite the instructions. Iterative prompt engineering reduces errors.
Take a failing trace. Look at the system prompt. Is it clear? Does it define the output format? Does it restrict the scope? Rewrite it to be more specific. Add examples of correct behavior.
A/B test the new prompt. Run the same inputs through both versions. Measure the success rate. The new prompt should have fewer tool failures. It should have higher accuracy. Document the change. Link it to the KPI improvement.
# Example: A/B testing prompt versions
def run_agent_test(prompt_version, test_data):
    results = []
    for item in test_data:
        response = agent.run(prompt=prompt_version, input=item)
        is_correct = evaluate(response, item.expected)
        results.append(is_correct)
    return sum(results) / len(results)

# Compare v1 vs v2
score_v1 = run_agent_test(PROMPT_V1, TEST_DATASET)
score_v2 = run_agent_test(PROMPT_V2, TEST_DATASET)

print(f"V1 Score: {score_v1}")
print(f"V2 Score: {score_v2}")
This script runs a dataset against two prompts. It calculates the accuracy score. Use this to justify prompt changes. Update the observability platform with the new version. Track the drift. If performance drops, revert quickly.
Debugging non-deterministic workflows requires replaying traces, analyzing tool failures, and optimizing prompts based on concrete evidence from the observability platform.
Advanced Techniques: Multi-Agent Collaboration and Governance
Observing Multi-Agent Workflows
Multi-agent systems introduce complexity that single-agent traces cannot resolve. You need to see the handoffs between distinct components. A Researcher agent might fetch data, then pass it to a Writer agent. If the Writer hallucinates, you must determine if the error came from the LLM or the input data.
Visualizing the interaction graph reveals these dependencies. LangGraph provides a state machine view that maps transitions between agents. This visualization helps you spot circular dependencies or dead ends in the workflow.
# Define the state schema for the multi-agent workflow
class AgentState(TypedDict):
    researcher_output: str
    writer_output: str
    final_answer: str

# Define the nodes for each agent
def research_node(state: AgentState) -> AgentState:
    # Simulate fetching data
    state['researcher_output'] = "Data fetched successfully"
    return state

def write_node(state: AgentState) -> AgentState:
    # Simulate writing based on research
    state['writer_output'] = f"Draft based on: {state['researcher_output']}"
    return state

# Build the graph
graph = StateGraph(AgentState)
graph.add_node("researcher", research_node)
graph.add_node("writer", write_node)

# Define the edges
graph.add_edge("researcher", "writer")
graph.set_entry_point("researcher")
app = graph.compile()
This code constructs a simple directed graph. The researcher node runs before the writer node. You can trace the state changes through each step.
Bottlenecks often appear at the communication layer. High latency between agents suggests a network issue or a slow tool call. Monitor the time delta between the end of one agent's span and the start of the next.
Debugging inter-agent conflicts requires comparing outputs. If two agents provide contradictory facts, inspect their source tools. One agent might be using a stale cache while the other uses the live API.
The log above shows a clean handoff. The Writer received the exact string from the Researcher. If the Writer said "$99", you would check the Researcher's raw output for discrepancies.
Implementing Guardrails and Safety Checks
Observability data feeds directly into safety mechanisms. You can monitor outputs in real-time for harmful patterns. This prevents bad data from reaching the end user.
Use automated checks for PII and sensitive data. Tools like Presidio detect emails, phone numbers, and credit card numbers. Run this check before the output leaves your system.
def check_and_redact(text: str) -> str:
    analyzer = AnalyzerEngine()
    results = analyzer.analyze(text=text, language='en')

    if results:
        anonymizer = AnonymizerEngine()
        return anonymizer.anonymize(
            text=text,
            analyzer_results=results
         ).text
    return text

# Example usage
user_input = "Call me at 555-0199"
safe_output = check_and_redact(user_input)
print(safe_output)
This script detects PII and replaces it with a placeholder. The AnalyzerEngine finds entities. The AnonymizerEngine redacts them. You can trigger alerts if PII is detected in a context where it should not exist.
Monitoring for biased outputs requires a different approach. You might use a secondary model to score the toxicity of a response. If the score exceeds a threshold, block the output.
Alerts for unsafe behavior should be immediate. A guardrail blocking a harmful output needs a log entry. This entry should include the input, the output, and the reason for blocking.
This log entry captures the failure. The agent tried to return sensitive data. The guardrail intercepted it. You can review these blocks to refine your prompt instructions.
Governance and Auditability
Regulatory compliance requires a clear chain of custody. Every agent action must be logged. This includes tool calls, state changes, and final outputs.
Maintain an audit log for financial transactions. If an agent moves money, log the prompt, the tool parameters, and the result. You must know who authorized the transfer. This record supports forensic analysis later.
def log_audit_entry(action: str, details: dict):
    entry = {
         "action": action,
         "details": details,
         "timestamp": datetime.datetime.now().isoformat(),
         "user_id": "system_agent_01"
     }
     # In production, write to a secure, immutable log store
    print(f"AUDIT: {entry}")

# Simulate a financial transaction
log_audit_entry(
     "transfer_funds",
     {"from": "acc_123", "to": "acc_456", "amount": 1000}
)
This function creates a structured audit entry. It records the action and the parameters. The timestamp ensures chronological ordering. You can query this log for compliance reviews.
Executives need high-level visibility. A dashboard showing agent KPIs helps them understand performance. Track metrics like success rate, cost per task, and latency.
for key, value in dashboard_data.items():
    print(f"{key}: {value}")
This code prints the key metrics for a specific agent. The success rate indicates reliability. The cost per task helps with budgeting. The risk score summarizes safety checks.
Governance ensures that agents operate within defined boundaries. Without logs, you cannot prove compliance. With logs, you can reconstruct any event.
Scaling Observability for Enterprise Workloads
High-volume trace data can overwhelm your storage. You need efficient handling strategies. Sampling is one such strategy.
Use sampling for non-critical paths. Not every trace needs full detail. Sample 1% of successful, low-risk traces. Keep 100% of failed or high-cost traces.
def should_sample(trace_cost: float, is_success: bool) -> bool:
     # Always keep failures and high-cost traces
    if not is_success or trace_cost > 1.0:
        return True
     # Sample 10% of successful, low-cost traces
    return random.random() < 0.1

# Example decision
trace_cost = 0.05
is_success = True
sample = should_sample(trace_cost, is_success)
print(f"Sample this trace: {sample}")
This function decides whether to keep a trace. It prioritizes failures. It reduces cost for routine operations. This balance keeps your observability platform manageable.
Data retention policies manage long-term storage. Keep detailed traces for 30 days. Archive aggregated metrics for 1 year. Delete raw logs after 90 days if not needed for audit.
Implementing these policies requires a cost analysis. Calculate the storage cost per trace. Multiply by the expected volume. Compare this to your budget.
total_daily_cost = daily_traces * cost_per_trace_mb
monthly_cost = total_daily_cost * retention_days

print(f"Daily Cost: ${total_daily_cost}")
print(f"Monthly Retention Cost: ${monthly_cost}")
This calculation estimates your monthly spend. It assumes a fixed cost per trace. You can adjust the retention days to fit your budget.
Scalability of the observability platform itself is critical. Ensure your database can handle the write load. Use sharding or partitioning if necessary.
Advanced observability must handle multi-agent collaboration, enforce safety guardrails, and ensure governance and auditability for enterprise scale. You need tools that visualize interactions, detect PII, and log every action. Sampling and retention policies keep costs manageable. This approach supports reliable, compliant agentic systems.
Troubleshooting Common Agentic Observability Challenges
Agentic workflows generate trace data at a volume that crushes standard databases. A single user query can spawn hundreds of internal tool calls. Each call creates a unique trace ID. Each ID adds a new dimension to your metrics. This explosion makes aggregation slow and expensive.
You must reduce cardinality before it hits your storage layer. Sample traces aggressively for non-critical paths. Keep full fidelity only for the final user-facing response. This approach keeps costs down without losing visibility into the most important outcomes.
def should_sample_trace(agent_id: str, trace_id: str) -> bool:
    """
    Determine if a trace should be kept based on a simple
    probability threshold. In production, use a hash of the
    trace_id for consistent sampling.
    """
    # 10% sampling rate for non-critical background agents
    return random.random() < 0.1

def log_trace(trace_id: str, agent_id: str, is_critical: bool):
    if is_critical:
        # Always log critical user-facing traces
        save_full_trace(trace_id)
    elif should_sample_trace(agent_id, trace_id):
        # Log a subset of background traces
        save_sampled_trace(trace_id)
Use aggregation to summarize high-cardinality metrics. Group user IDs into buckets if you need trend data. Do not store every unique user ID in a time-series database. Store the count of unique users in a defined range instead. This keeps query speeds fast and storage costs low.
LangSmith allows you to configure sampling strategies directly. Set a percentage for specific agent types. This prevents your dashboard from being flooded with low-value data. You still see the overall success rate without the noise.
High-cardinality data slows down queries. A single query on a high-cardinality field can take minutes. Tune your storage schema to avoid this bottleneck. Use indexed fields for common filters like agent ID or status. Leave high-cardinality fields like user email out of the index.
Long reasoning chains hide errors deep inside the logic. A single mistake in step three can invalidate the final answer. Standard logs show the start and end points. They rarely show the intermediate thought process. You need a way to see the chain of thought.
Visualize the reasoning steps as a graph. Each node represents a decision or tool call. Edges show the flow of information. This view helps you spot where the agent went off track. Look for loops or dead ends in the graph.
# Example usage
chain = [
    {'step': 1, 'content': 'Query DB', 'status': 'success'},
    {'step': 2, 'content': 'Analyze Result', 'status': 'error'},
    {'step': 3, 'content': 'Retry Query', 'status': 'pending'}
]
result = analyze_reasoning_chain(chain)
print(result)
This function scans the chain for the first error. It returns the index and content of the failing step. This makes it easy to isolate the problem. You can then examine the input that caused the failure.
Use annotations to explain complex reasoning steps. Add comments to the trace data. Explain why the agent chose a specific tool. This context helps you understand the decision logic. Without it, you are guessing the intent.
Collaborate with domain experts to validate reasoning. Show them the trace graph. Ask them if the steps make sense. They can spot logical gaps that code cannot. This feedback loop improves the agent over time.
External tools fail. APIs change. Rate limits hit. These failures break the agent's flow. You need to observe the impact of these failures. Track latency and reliability for every tool call. This data reveals weak points in your stack.
Implement fallback mechanisms for critical tools. If the primary API fails, try a secondary source. If that fails, return a cached result. This keeps the agent moving forward. It prevents a single point of failure from stopping the whole workflow.
def call_tool_with_fallback(tool_name: str, params: dict):
    """
    Attempt to call a tool. If it fails, try a fallback
    or return a default response.
    """
    try:
        response = requests.get(f"https://api.example.com/{tool_name}", params=params)
        response.raise_on_status()
        return response.json()
    except requests.exceptions.RequestException:
        # Fallback logic here
        return {"status": "error", "message": "Tool failed"}
This code attempts a request and catches exceptions. If the request fails, it returns a default error response. This prevents the agent from crashing. You can extend this to try multiple sources.
Monitor tool latency closely. High latency slows down the agent. It increases the cost per task. Set alerts for latency spikes. Investigate the cause immediately. Is the API slow? Is the network unstable?
Debug issues caused by external API changes. APIs evolve. Fields drop. New errors appear. Update your tool wrappers to handle these changes. Test your agents against the new API version. This prevents silent failures.
Agentic workflows handle sensitive data. PII flows through the traces. You must redact this data. Store only what you need. This reduces risk and keeps you compliant with regulations like GDPR.
Identify and redact PII in trace data. Use a library to detect emails and phone numbers. Replace them with placeholders. This keeps the trace structure intact. It removes the sensitive information.
def redact_pii(text: str) -> str:
    """
    Simple regex-based PII redaction.
    In production, use a library like Microsoft Presidio.
    """
    # Pattern for email addresses
    email_pattern = r'[a-zA-Z0-9._%+-]+@[a-zA-Z0-9.-]+\.[a-zA-Z]{2,}'
    text = re.sub(email_pattern, '[EMAIL]', text)

    # Pattern for phone numbers (simple US format)
    phone_pattern = r'\b\d{3}[-.]?\d{3}[-.]?\d{4}\b'
    text = re.sub(phone_pattern, '[PHONE]', text)

    return text
Implement access controls for observability data. Restrict who can view raw traces. Only allow access for specific roles. This prevents unauthorized access to sensitive information. Log all access attempts.
Comply with data privacy regulations. Know where your data lives. Ensure it stays within the required region. This is critical for healthcare and financial data. Audit your data retention policies. Delete old traces automatically.
Audit access to sensitive trace data. Keep a log of who viewed what. This helps you investigate breaches. It also deters misuse. Make this log immutable. Do not allow users to delete it.
Common challenges include handling high-cardinality data, debugging complex reasoning, managing external tool dependencies, and ensuring data privacy. Address these areas directly to build a reliable observability stack.
Conclusion: The Future of Observability in Agentic AI
Recap: The New Observability Stack for Agents
Tracing, logging, and evaluation form the backbone of agent reliability. Traditional logs capture static states. Agent logs must capture dynamic reasoning chains.
Tracing maps the flow of data between tools and models. It reveals where a decision went wrong. Logging records the inputs and outputs of each step. It provides the raw material for analysis. Evaluation scores the quality of the output. It turns subjective judgments into measurable metrics.
Non-deterministic debugging requires this triad. You cannot fix what you cannot see. The observability stack acts as the control plane for autonomous systems.
Shift your focus from infrastructure health to reasoning health. An agent might run on healthy servers but produce garbage results. Monitor the logic, not just the CPU.
The Role of SREs in the Agentic Era
SREs must adapt to debugging reasoning failures. Infrastructure errors are clear. Hallucinations are subtle. You need new mental models.
Collaboration between AI engineers and SREs is critical. AI engineers understand the model behavior. SREs understand system reliability. Combine these perspectives.
Autonomous SREs use agentic AI to monitor systems. They analyze telemetry without human intervention. This shifts the workload from reactive fixes to proactive analysis.
Use observability data to fix agent issues directly. For example, an SRE might detect a repeated tool failure. They can trigger a retry logic or alert the developer.
import logging
from dataclasses import dataclass
from typing import List

@dataclass
class AgentEvent:
    agent_id: str
    action: str
    success: bool
    error_message: str | None

def analyze_events(events: List[AgentEvent]) -> None:
    """
    Analyze a sequence of agent events to detect patterns.
    """
    failures = [e for e in events if not e.success]

    if len(failures) > 3:
        logging.warning(
            f"Agent {failures[0].agent_id} failed {len(failures)} times. "
            f"Last error: {failures[-1].error_message}"
         )
         # Trigger alerting or remediation logic here
    else:
        logging.info(f"Agent {events[0].agent_id} operating within normal parameters.")

# Example usage
sample_events = [
    AgentEvent("agent_1", "search", True, None),
    AgentEvent("agent_1", "parse", True, None),
    AgentEvent("agent_1", "write", False, "API Timeout"),
    AgentEvent("agent_1", "write", False, "API Timeout"),
]

analyze_events(sample_events)
This code detects repeated failures. It logs a warning when a threshold is crossed. SREs can hook this into their alerting systems.
Emerging Trends in Agentic Observability
Observability agents are emerging to monitor other agents. These specialized tools analyze telemetry in real time. They detect anomalies that human reviewers might miss.
Causal discovery links events to root causes. It moves beyond correlation. You can identify the specific prompt change that caused a drift.
Standardization of agentic observability metrics is underway. We need common definitions for success and failure. This helps teams compare performance across different systems.
Governance and compliance are becoming central. Agents handle sensitive data. Audit trails must be immutable and detailed.
import hashlib
import time
import json
from typing import Any

class AuditLogger:
    def __init__(self, agent_id: str):
        self.agent_id = agent_id
        self.log = []

    def log_action(self, action: str, input_data: Any, output_data: Any) -> None:
        timestamp = time.time()

         # Create a deterministic hash for the input
        input_str = json.dumps(input_data, sort_keys=True)
        input_hash = hashlib.sha256(input_str.encode()).hexdigest()

        record = {
             "timestamp": timestamp,
             "agent_id": self.agent_id,
             "action": action,
             "input_hash": input_hash,
             "output_data": output_data
         }

        self.log.append(record)
        print(f"Audit logged for {action} at {timestamp}")

# Example usage
audit = AuditLogger("financial_agent")
audit.log_action(
     "calculate_balance",
     {"user_id": "u123", "amount": 100},
     {"balance": 1000}
)
This logger creates an immutable audit trail. It hashes inputs to prevent tampering. Compliance teams can verify actions later.
Final Recommendations for Implementation
Start with basic tracing and logging. Do not over-engineer the initial setup. Get the data flowing first.
Iteratively add evaluation and advanced metrics. Add cost tracking once tracing is stable. Add quality scoring once you have enough data.
Prioritize security and privacy from the start. Redact PII in your logs. Mask sensitive tokens. Do not add this later.
Build a culture of continuous improvement. Share trace links with the team. Discuss failures openly. Use data to guide prompt changes.
Autonomous monitoring tools reduce manual overhead. Causal discovery helps isolate root causes faster. Standardized metrics allow for better benchmarking. Focus on these practical steps to improve reliability.
Work with us
Let's build something together
We build fast, modern websites and applications using Next.js, React, WordPress, Rust, and more. If you have a project in mind or just want to talk through an idea, we'd love to hear from you.
Related Articles
Engineering • 7 min
Mastering Agentic Workflows: Python Skills for 2026 Developers
Learn agentic workflows in Python. Master orchestration, state management, and verification loops to replace unreliable vibe coding with deterministic engineering.
5/2/2026
Engineering • 8 min
Agentic CI Pipelines: Autonomous Code Review & Testing Tutorial
Learn to build agentic CI pipelines that autonomously review code, generate tests, and self-heal. Replace static automation with AI agents for faster, reliable deployments.
5/4/2026
Engineering • 7 min
Beyond Hard-Coded Endpoints: Building Agentic-Native APIs for Autonomous Systems
Learn how agentic-native APIs replace static REST endpoints with self-describing, discoverable interfaces designed for autonomous AI agent consumption and stability.
5/3/2026