Go 1.27 goroutine leak profiles
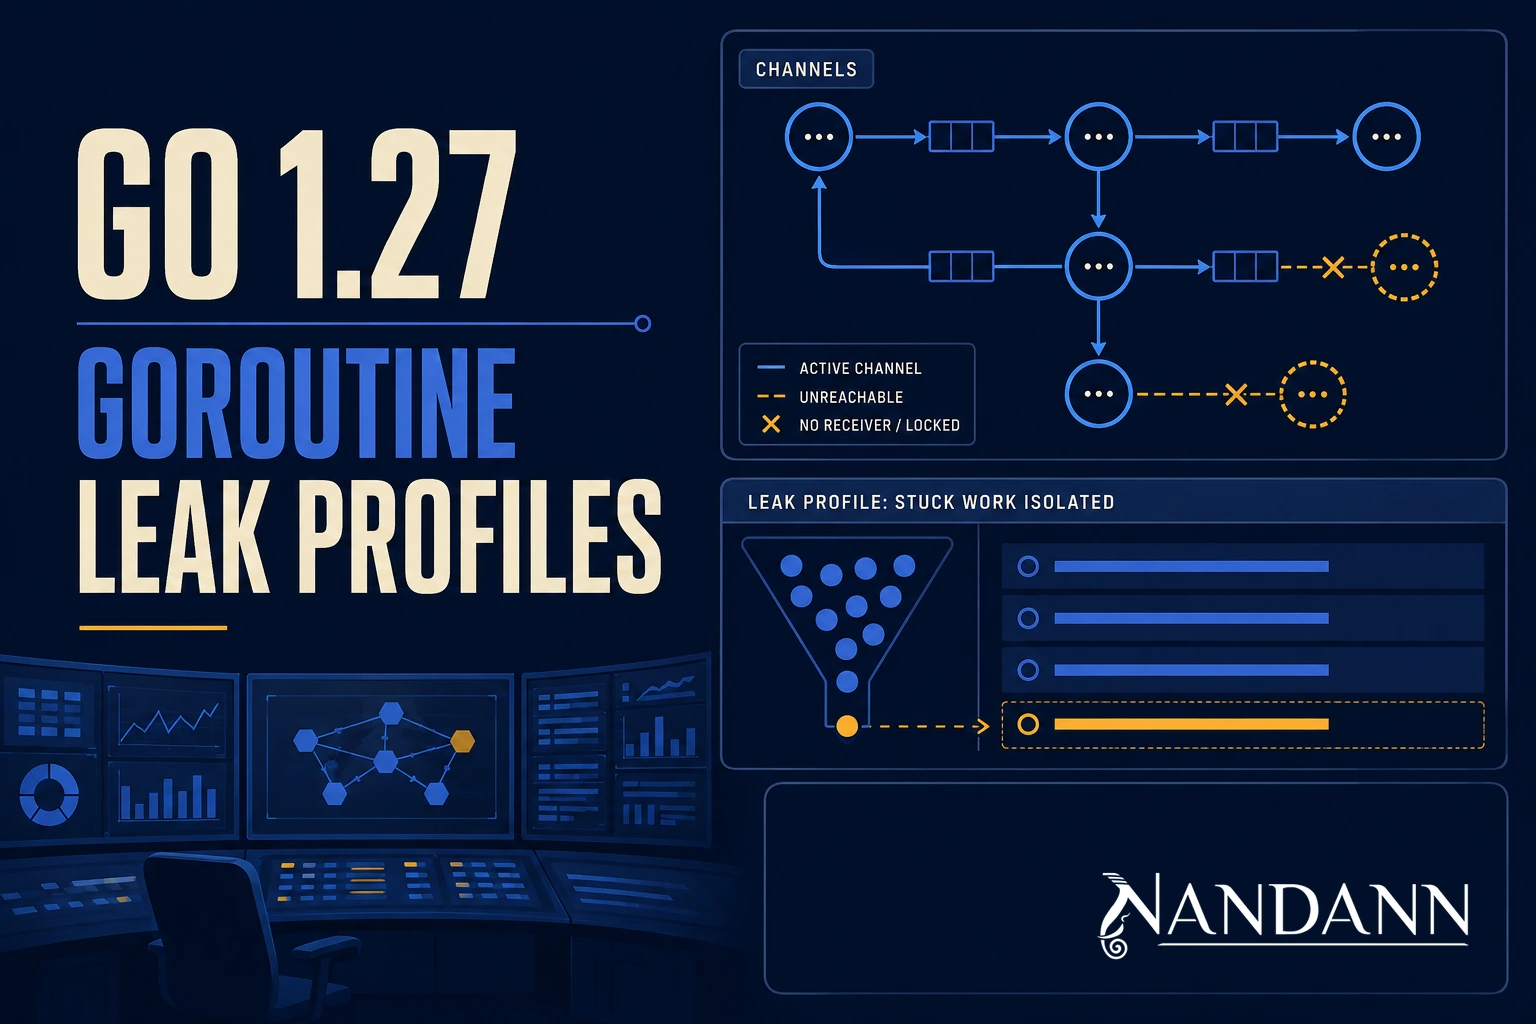
The easiest Go incident to underestimate is the one with no obvious outage. Request latency remains acceptable. CPU is quiet. The fleet is healthy enough to distract everyone. But a background worker has taken one code path where no receiver will ever arrive, and its goroutine will wait for the rest of the process lifetime. Repeat that path for a few days and the service has a reliability problem that looks like a slow change in memory, file descriptors, work queues, or shutdown behavior.
Historically, a production investigation started with a goroutine dump and human pattern matching. That still works, but it is hard to turn into a reliable signal. A dump contains legitimate long-lived goroutines as well as the pathological ones. Tests can catch a lot with go.uber.org/goleak, but a passing test cannot recreate every cancellation, dependency, and traffic shape found in production.
Go 1.27 makes a meaningful part of this problem observable. Its goroutineleak profile is now a supported runtime/pprof profile, after appearing experimentally in Go 1.26. It reports goroutines that are permanently blocked on channels or recognized synchronization primitives when the runtime can prove enough about their liveness. That last qualification is the whole design: this is not a universal deadlock detector. It is a deliberately conservative detector for a class of leaks that otherwise hide in plain sight.
The practical opportunity is not to page on every profile entry. It is to add a small, explainable loop to the service playbook: collect, establish a baseline, investigate changes, reproduce the causal path, then install a regression test. That is a far better operating model than waiting for the next goroutine dump to become an archeological dig.
What Go 1.27 Actually Added
A profile, not a new concurrency primitive
The new profile sits alongside familiar runtime/pprof profile names. In an instrumented service with the standard HTTP pprof handler available, it can be fetched at /debug/pprof/goroutineleak. From a trusted diagnostics environment, a first collection looks like this:
# Do not expose net/http/pprof publicly. Reach this through a protected path.
go tool pprof \
  http://127.0.0.1:6060/debug/pprof/goroutineleak
The profile gives stacks for goroutines the runtime identifies as leaked. That makes it much more actionable than a single metric. The owner can see the blocking operation, the call chain that created it, and the package boundary where a cancellation or shutdown contract was missed.
Go 1.26 introduced the machinery as an experiment. Go 1.27 removes that experiment flag and documents goroutineleak as a standard profile. That maturity matters operationally. It means teams can write runbooks and CI checks around a documented runtime interface instead of carrying an environment-dependent feature switch.
The narrow definition is a feature
The runtime targets goroutines blocked indefinitely on channels and synchronization primitives that it understands. It intentionally does not claim to recognize every kind of stuck work. File and network I/O, direct system calls, cgo boundaries, and custom synchronization protocols remain outside the reliable detection set.
That restraint keeps the profile useful. A detector that calls every long-running background loop a leak would produce enough noise to be ignored. Go instead tries to report cases where a goroutine has stopped making progress and the objects it waits on are no longer live in a way that could release it.
Read the output as evidence, not a verdict. A profile entry deserves investigation. An empty profile is good news about this particular class of leak, not proof that an entire concurrency design is perfect.
Why Goroutine Leaks Are So Expensive
They retain more than a stack
A goroutine starts small, so teams sometimes treat a few hundred extra goroutines as cosmetic. The cost is usually indirect. A blocked worker may retain a request buffer, a context value, a queue item, a timer, a client, a channel, or a closure that keeps a larger object graph alive. It may also keep a work item invisible from the system that expected a completion signal.
The outcome is often a misleading symptom: a slowly rising heap, a pool that never drains, graceful shutdown that exceeds its deadline, or a service that cannot make progress after a downstream dependency flakes. Counting goroutines helps establish that something changed. It rarely points to why.
Normal blocking is not leaking
Servers correctly keep goroutines asleep in accept loops, ticker loops, and queue consumers. A worker waiting for work is healthy if a producer can still deliver work. A request handler waiting on a database is not automatically a leak. The distinction is whether a future event can release it under the program's real lifecycle rules.
That is why raw goroutine dumps make poor alerts. They tell you every place a goroutine happened to be at one instant. The new profile has a more valuable question: has the runtime found a blocked goroutine whose release path has become unreachable?
The Runtime Model: Reachability Meets Blocking
Garbage collection supplies the evidence
The implementation uses garbage-collector reachability and goroutine liveness. At a high level, the runtime can identify a blocked goroutine and reason about whether the channel or synchronization object it needs can still be reached by code that might wake it. An unblocked goroutine is treated as a live starting point. References from active execution, globals, and other roots affect what the collector can prove.
That model explains both the high confidence and the blind spots. If the waiting object has no plausible live path to an operation that releases the waiter, the runtime can flag the goroutine. If the object remains reachable from a global or from a runnable goroutine, it may not be safe to call the wait permanent, even when a human knows the application has abandoned it.
A daisy chain can be expensive to inspect
Reachability analysis is not free. Go's documentation calls out potentially slower garbage collection for unfavorable chains of blocked goroutines and synchronization objects. This does not mean the feature is unsafe. It means an observability plan should be measured like any other runtime feature.
Start with infrequent collection in staging and a controlled production subset. Compare GC pause behavior, CPU, and profile output under representative load. The Go team gives periodic collection, such as every few hours, as a reasonable example. A high-throughput API with a disciplined concurrency model may need far less. A system that has already shown leak symptoms may temporarily need more.
Six Leak Shapes Worth Recognizing
1. A send with no receiver
func notify(ch chan<- string) {
    ch <- "finished" // blocks forever if its receiver exited
}
The bug is not the send itself. It is the missing ownership rule. Who closes the work? Who drains the result? What happens when the caller returns early? If the receiver is optional, use a context-aware select or give the sender a bounded handoff path.
func notify(ctx context.Context, ch chan<- string) error {
    select {
    case ch <- "finished":
        return nil
    case <-ctx.Done():
        return ctx.Err()
    }
}
The context does not magically fix all lifecycle mistakes. It creates a release path the caller can own and test.
2. An early return that abandons a producer
This version looks familiar in fan-out code:
func firstResult(ctx context.Context, jobs []Job) (Result, error) {
    results := make(chan Result)
    for _, job := range jobs {
        go func(job Job) { results <- run(job) }(job)
    }
    select {
    case result := <-results:
        return result, nil
    case <-ctx.Done():
        return Result{}, ctx.Err()
    }
}
The function returns after one result. The remaining workers can become blocked trying to send into results. A buffered channel only delays the failure. The durable fix is coordinated cancellation and a contract that every worker observes it.
func firstResult(ctx context.Context, jobs []Job) (Result, error) {
    ctx, cancel := context.WithCancel(ctx)
    defer cancel()
    results := make(chan Result, 1)

    for _, job := range jobs {
        go func(job Job) {
            result := runWithContext(ctx, job)
            select {
            case results <- result:
            case <-ctx.Done():
            }
        }(job)
    }
    select {
    case result := <-results:
        return result, nil
    case <-ctx.Done():
        return Result{}, ctx.Err()
    }
}
In real code, pair this with a WaitGroup when the caller must know cleanup completed. Cancellation tells work to stop; waiting confirms the stop was honored.
3. A range that waits for a close nobody owns
for item := range work {
    handle(item)
}
The loop is only as correct as the channel ownership. If no producer is responsible for closing work, the consumer can block forever after the final item. In a service, that may only appear during a rare error branch or shutdown.
Make closing part of the API. Document the sole closer. If multiple producers exist, coordinate them behind one closer. If an open-ended stream is intentional, make the consumer context-aware rather than relying on a close that will never happen.
4. A timer or ticker that outlives its owner
Timers do not always leak in the profile's narrow sense, but lifecycle mistakes around them commonly create goroutines that do. A component starts a ticker and a processing goroutine, then returns an object without a Close or Stop contract. Later, tests pass because the process exits; production accumulates abandoned workers.
Treat every background goroutine like an acquired resource. The constructor should make its owner obvious. The owner should have a shutdown method or a parent context. The test should exercise shutdown before the test returns.
5. WaitGroup ownership errors
WaitGroup does not cancel work. It only counts. Calling Add after another goroutine can reach Wait, failing to call Done, or using a group whose ownership is unclear can leave a waiter parked forever. Go's docs and vet checks help with several misuse patterns, but the code review question is simpler: which scope owns completion, and can every launched goroutine reach it?
6. A dependency that ignores cancellation
You can thread context.Context through every local function and still leak if the client call underneath never sees it. Check the actual method invoked: QueryContext, NewRequestWithContext, CommandContext, and client-specific context APIs exist for a reason. During review, trace cancellation across package boundaries, not merely to the first helper.
Collecting the Profile Safely
Keep diagnostic endpoints private
net/http/pprof is powerful. It can reveal stack traces, allocation behavior, mutex contention, and implementation details. Do not put it on a public listener. Bind it to loopback, a private admin port, a sidecar-only endpoint, or a protected internal route with network and authentication controls.
import (
    "log"
    "net/http"
    _ "net/http/pprof"
)

func serveDebug() {
    go func() {
        log.Println(http.ListenAndServe("127.0.0.1:6060", nil))
    }()
}
This import registers the pprof handlers on the default mux. In a larger service, it is often better to mount them on a dedicated mux and listener so the exposure is deliberate.
Make collection bounded and attributable
Name the collector job. Record service version, deployment, region, and collection time with the artifact. Keep profile files out of public object storage. A response to a non-zero count should be an investigation ticket with the stacks attached, not an automatic restart that destroys the evidence.
A small internal job might collect once per release candidate, after a traffic ramp, and then every few hours in steady state. The important thing is consistency. A baseline makes a single new entry meaningful; an unstructured pile of profiles does not.
How to Read a Non-Zero Result
Start at the blocking frame
Look first for the blocking primitive: channel send, channel receive, sync.(*Mutex).Lock, sync.(*Cond).Wait, sync.(*WaitGroup).Wait, or a recognized equivalent. Then follow outward to the business operation that owns it. The final stack frame is rarely the cause. The cause is often the code that returned early, omitted a close, or created a worker without a cancellation boundary.
Classify each entry before changing code:
- expected and owned: demonstrate the release path and document it;
- stale work: identify the cancellation boundary;
- missing completion: identify the closer or
Doneowner; - runtime or dependency behavior: reduce to a test and inspect upstream documentation.
The discipline matters because a profile is a snapshot of evidence, not an invitation to add random channel buffers.
Reproduce with the smallest failing test
After finding the production stack, write a test that triggers the cancellation or early return. goleak is useful here because it watches the test process for goroutines left behind at test completion.
func TestWorkerStopsWhenContextCancels(t *testing.T) {
    defer goleak.VerifyNone(t)

    ctx, cancel := context.WithCancel(context.Background())
    done := startWorker(ctx)
    cancel()

    select {
    case <-done:
    case <-time.After(time.Second):
        t.Fatal("worker did not stop")
    }
}
For timing-sensitive behavior, testing/synctest can make a concurrency test deterministic instead of relying on sleeps. The runtime profile finds a production-shaped problem. A focused test preserves the fix. They complement each other.
A Sensible Rollout Plan
Week one: establish a baseline
Enable the protected diagnostics endpoint in staging. Exercise normal traffic, cancellation paths, queue drains, deployment shutdown, and dependency timeouts. Capture a profile at each point. If it reports entries, investigate them before declaring a production baseline.
In production, begin on one low-risk service or a small slice. Collect at a known cadence. Measure GC behavior. Store only what the response team can protect and retrieve.
Week two: tie profiles to changes
Compare counts and stacks across releases rather than treating one count as a universal threshold. A new stack after a specific deployment is a crisp review target. A steadily increasing count tied to one route or job type deserves stronger alerting. Stable, explained entries should still be documented, but should not page an on-call engineer at 3 a.m.
Week three: harden the code path
Add the minimal regression test. Add context propagation where the ownership boundary was unclear. Give background components a stop contract. Use a WaitGroup when joining work matters. Then verify the resulting profile on a deploy that exercises the previously failing path.
That loop turns an advanced runtime feature into a normal reliability habit.
What the Profile Cannot Tell You
I/O and custom waits remain your job
A goroutine blocked in network or file I/O may be legitimately waiting, stuck on a dependency, or uninterruptible because a context never reached the syscall. goroutineleak will not provide a comprehensive answer for that class. Pair it with request latency, dependency metrics, traces, goroutine dumps, and application-level timeout accounting.
Likewise, a custom semaphore implemented with unusual state or a protocol spread across packages may not be recognized. Prefer standard primitives where possible. When a custom primitive is warranted, document its cancellation and close semantics as carefully as a public API.
A zero profile is not a zero-risk claim
The detector may miss an actual leak if a global keeps the waiting object reachable or another runnable goroutine still references it. A zero result means the runtime did not find a provable leak in its target set. It should reduce uncertainty, not end the investigation if heap growth, shutdown hangs, or request symptoms continue.
Turn Findings Into an Incident Card
When the profile produces an entry, capture the evidence in a form the next engineer can use. A useful incident card contains the release identifier, stack signature, count, first observation, workload or route correlation, expected owner, and the smallest proposed reproduction. It also records why the stack is believed to be a leak rather than a designed long-lived waiter.
This sounds administrative, but it prevents a common failure mode: the original observer restarts a pod, the stack disappears, and a later team sees the same symptom with none of the causal context. A restart may be the right mitigation for capacity. It is not a root-cause analysis.
A Review Checklist for Concurrent Changes
Before approving a pull request that starts a goroutine, ask a few direct questions. What owns the goroutine? Which event ends it? Does every blocking operation observe the same context or close signal? Can a caller return before a producer has delivered? Is a buffer masking an ownership failure? How does a test prove cleanup completed?
The profile is most useful after these questions have become normal review language. It then acts as an independent production check on the contract the code claims to enforce.
Measure the Signal Alongside Service Health
Add the profile result to an existing operational picture rather than creating an isolated dashboard. A rising leak count becomes much more useful when plotted with goroutine count, heap objects, GC cycle duration, request cancellation rate, queue depth, deploy timestamps, and graceful-shutdown duration. The relationships tell a story: a new stack after a rollout is different from a steady count that has existed for months; a count that rises only during one batch job is different from one that grows with request volume.
Avoid converting every profile entry into a high-urgency alert on day one. Alert on a sustained change that has an owner and a documented response. For example, an internal collector can record the entry count and stack fingerprints, open an investigation on a new fingerprint, and page only when a known leak pattern rises alongside a capacity or availability symptom. This keeps the detector high-signal rather than teaching the team to mute it.
Shutdown Is the Best Leak Test
The most revealing integration test for a service is often not peak load. It is a controlled shutdown while it has accepted work, is waiting on a dependency, and is draining a queue. Send the termination signal, stop accepting new work, cancel the root context, wait for bounded cleanup, and verify the process reaches its deadline. Capture a goroutine-leak profile before and after that sequence in staging.
This test forces ownership decisions into the open. A component that cannot explain how it stops has not finished its API design. Go 1.27's profile provides another way to verify the result once the same lifecycle reaches production traffic.
Design Rules That Prevent Most Leaks
- Every goroutine has an owner.
- Every owner has a cancellation or shutdown path.
- Every channel has a documented sender, receiver, and closer contract.
- Every blocking send and receive at a boundary has a reason it can finish.
- Every fan-out path explains how losing workers stop.
- Every external operation receives the context that owns its deadline.
- Every fix for a production leak receives a regression test.
These are not ceremony. They make code review questions answerable before a runtime profile has to find the mistake.
The Bottom Line
Go 1.27's goroutineleak profile is valuable precisely because it is modest. It does not pretend to classify every slow or blocked goroutine. It gives production teams a high-signal view of goroutines the runtime can show are permanently stranded on known synchronization paths.
Expose it safely, collect it periodically, measure the GC trade-off, and investigate changes against a baseline. Then use goleak and deterministic concurrency tests to keep each repaired path repaired. The result is not just fewer goroutines. It is a service whose concurrency ownership becomes visible, testable, and much easier to trust.
Sources and further reading
- Go Blog: Goroutine leak profiles
- Go 1.27 release notes
- runtime/pprof package documentation
- net/http/pprof package documentation
- Go 1.26 release notes
- Go 1.27 release announcement
- Go runtime garbage collector source
- Go goroutine leak profile test patterns
- testing/synctest package documentation
- go.uber.org/goleak package documentation
FAQs
What is Go 1.27's goroutineleak profile?
It is a runtime/pprof profile that reports a useful subset of goroutines permanently blocked on channels or synchronization primitives. It became a normal, supported profile in Go 1.27 after an experimental debut in Go 1.26.
Does goroutineleak find every goroutine leak?
No. It deliberately favors low false positives. It cannot generally identify goroutines blocked in file or network I/O, direct system calls, or application-defined synchronization primitives.
How do I retrieve the profile?
Use runtime/pprof in process, or expose the standard net/http/pprof endpoint and run go tool pprof against /debug/pprof/goroutineleak. Restrict that endpoint as carefully as any production diagnostic surface.
Should we sample it continuously?
Start with a periodic, bounded collection job and alert on a sustained non-zero or rising count. The Go team suggests occasional production collection; the correct cadence depends on request volume and GC cost.
Does the profile add runtime overhead?
The profile uses garbage-collector reachability analysis. Go documents potentially slower GC in unfavorable daisy-chain patterns, so measure collection on representative traffic before making it frequent.
Can it replace goleak tests?
No. goleak is excellent for tests, while the runtime profile observes a narrow set of production leaks. Use both, then add synctest where deterministic concurrency tests help.
Why can a goroutine be leaked even if it is still reachable?
Reachability and useful progress are different. A global reference or runnable goroutine can keep a synchronization primitive alive, which can prevent the runtime from classifying a blocked goroutine as leaked.
Work with us
Let's build something together
We build fast, modern websites and applications using Next.js, React, WordPress, Rust, and more. If you have a project in mind or just want to talk through an idea, we'd love to hear from you.
Related Articles
Engineering • 15 min
Workers AI rejectIfBusy: Fail Fast or Wait?
Learn how Workers AI rejectIfBusy changes overload behavior, how to handle error 3040, and when fail-fast inference is safer than queueing.
9/18/2026
Engineering • 22 min
GPT-6 Astra on AI Gateway: The Model Is Only Half the Agent
How to use GPT-6 Astra through Vercel AI Gateway without confusing model capability, routing, budgets, observability, and authorization.
9/9/2026
Engineering • 21 min
Rust 1.98.1
Rust 1.98.1 fixes a critical vtable miscompilation. Here is what failed, why safe Rust could still crash, and how teams should upgrade and verify their builds.
9/5/2026